Track ARs at individual time steps to form tracks
The modified Hausdorff distance definition
After the Detect AR appearances from THR output process, assume we have detected
- \(n\) ARs at time \(t\), and
- \(m\) ARs at time \(t+1\).
There are theoretically \(n \times m\) possible associations to link these two groups of ARs. Of cause not all of them are meaningful. The rules that are applied in the association process are:
- The nearest neighbor link method: for any AR at time \(t\), the nearest AR at time \(t+1\) “wins” and is associated with it, subject to that:
- the inter-AR distance (H) is \(\le 1200 \, km\).
- no merging or splitting is allowed, any AR at time \(t\) can only be linked to one AR at time \(t+1\), similarly, any AR at time \(t+1\) can only be linked to one AR at time \(t\).
- after all associations at any give time point have been created, any left-over AR at time \(t+1\) forms a track on their own, and waits to be associated in the next iteration between \(t+1\) and \(t+2\).
- any track that does not get updated during the \(t-(t+1)\) process terminates. This assumes that no gap in the track is allowed.
The remaining important question is how to define that inter-AR distance (H). Here we adopt a modified Hausdorff distance definition:
where \(H(A, B)\) is the modified Hausdorff distance from track A to track B, \(h_f(A,B)\) is the forward Hausdorff distance from A to B, and \(h_b(A,B)\) the backward Hausdorff distance from A to B. They are defined, respectively, as:
namely, the largest great circle distance of all distances from a point in A to the closest point in B. And the backward Hausdorff distance is:
Note that in general \(h_f \neq h_b\). Unlike the standard definition of Hausdorff distance that takes the maximum of \(h_f\) and \(h_b\), we take the minimum of the two.
The rationale behind this modification is that merging/splitting of ARs mostly happen in an end-to-end manner, during which a sudden increase/decrease in the length of the AR induce misalignment among the anchor points. Specifically, merging (splitting) tends to induce large backward (forward) Hausdorff distance. Therefore \(min \{ h_f(A,B), h_b(A,B) \}\) offers a more faithful description of the spatial closeness of ARs. For merging/splitting events in a side-to-side manner, this definition works just as well.
The nearest neighbor link method
To link AR records to form a track, a nearest neighbor method is used that the two AR axes found in consecutive time steps with a Hausdorff distance \(\leq 1200 \, km\) are linked, with an exclusive preference to the smallest Hausdorff distance.
Formally, suppose \(n\) tracks have been found at \(t=t\; :A = \{a_1, a_2, \cdots, a_n\}\), and \(t=t+1\) has \(m\) new records: \(B = \{ b_1, b_2, \cdots, b_m \}\). The Hausdorff distances between all pairs of possible associations form a distance matrix:
Then Algorithm shown in Fig. 6 is called with these arguments:
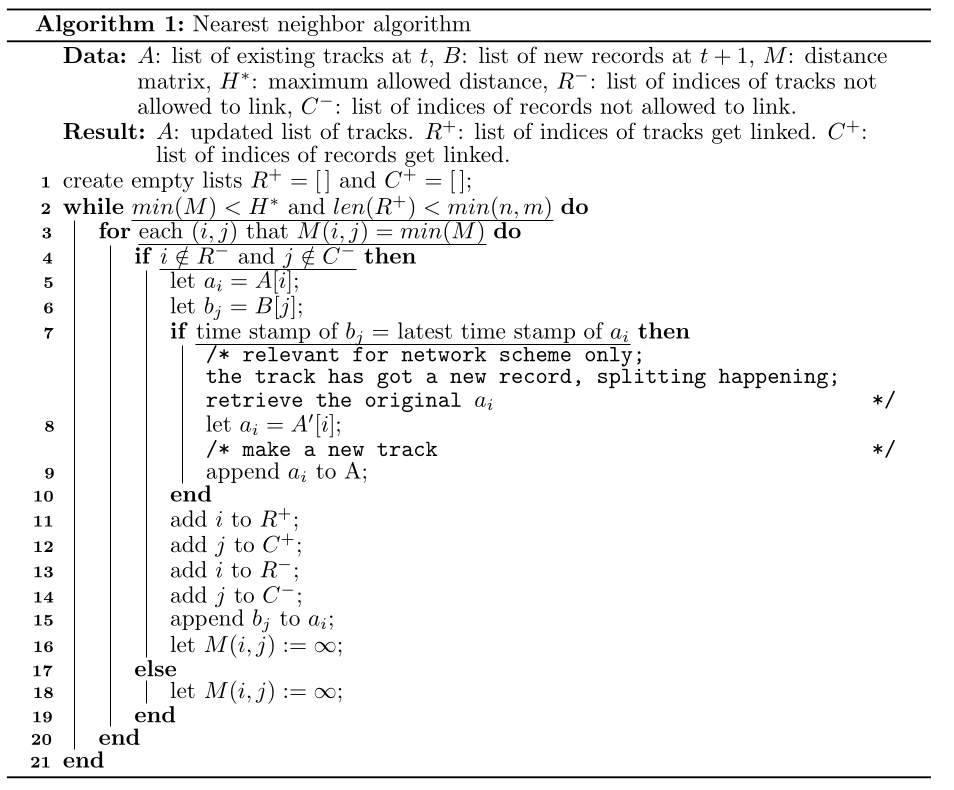
Fig. 6 Algorithm for the nearest neighbor link method.
The algorithm iteratively links two AR records with the smallest distance, so long as the distance does not exceed a given threshold \(H^*\).
It ensures that no existing track connects to more than one new records, and no new record connects to more than one existing tracks. After this, any left-over records in \(B\) form a new track on their own. Then the same procedure repeats with updated time \(t:=t+1\). Tracks that do not get any new record can be removed from the stack list, which only maintains a few active tracks at any given time. Therefore the complexity does not scale with time.
Note
One can use 3 consecutive calls of the above algorithm, with different input arguments, to achieve merging and splitting in the tracks.
Input data
This step takes as inputs the AR records detected at individual time steps as computed in Detect AR appearances from THR output.
The tracker parameters used:
# Int, hours, gap allowed to link 2 records. Should be the time resolution of
# the data.
TIME_GAP_ALLOW=6

# tracking scheme. 'simple': all tracks are simple paths.
# 'full': use the network scheme, tracks are connected by their joint points.
TRACK_SCHEME='simple'  # 'simple' | 'full'

# int, max Hausdorff distance in km to define a neighborhood relationship
MAX_DIST_ALLOW=1200  # km

# int, min duration in hrs to keep a track.
MIN_DURATION=24

# int, min number of non-relaxed records in a track to keep a track.
MIN_NONRELAX=1

# whether to plot linkage schematic plots or not
SCHEMATIC=True
Usage in Python scripts
The tracking process is handled by the AR_tracer.trackARs() function:
from ipart.AR_tracer import trackARs
from ipart.AR_tracer import readCSVRecord

ardf=readCSVRecord(RECORD_FILE)
track_list=trackARs(ardf, TIME_GAP_ALLOW, MAX_DIST_ALLOW,
    track_scheme=TRACK_SCHEME, isplot=SCHEMATIC, plot_dir=plot_dir)
where
RECORD_FILEis the path to thecsvfile saving the individual AR records. Refer to this notebook for more information on the creation of this file.ardfis apandas.DataFrameobject containing the AR records at individual time points.track_listis a list ofAR objects, each stores a sequence of AR records that form a single track. Thedataattribute of theAR objectis apandas.DataFrameobject, with the same columns as shown in AR records DataFrame.
After this, one can optionally perform a filtering on the obtained tracks,
using AR_tracer.filterTracks(), to remove, for instance, tracks
that do not last for more than 24 hours:
from ipart.AR_tracer import filterTracks
track_list=filterTracks(track_list, MIN_DURATION, MIN_NONRELAX)
Example output
The resultant AR track can be visualized using the following snippet:
from ipart.utils import plot
import cartopy.crs as ccrs

latax=np.arange(0, 90)
lonax=np.arange(80, 440)  # degree east, shifted by 80 to ensure monotonically increasing axis

plot_ar=track_list[6]  # plot the 7th track in list

figure=plt.figure(figsize=(12,6),dpi=100)
ax=figure.add_subplot(111, projection=ccrs.PlateCarree())
plotplotARTrack(plot_ar,latax,lonax,ax,full=True)
See also
The output figure looks like Fig. 7 below.
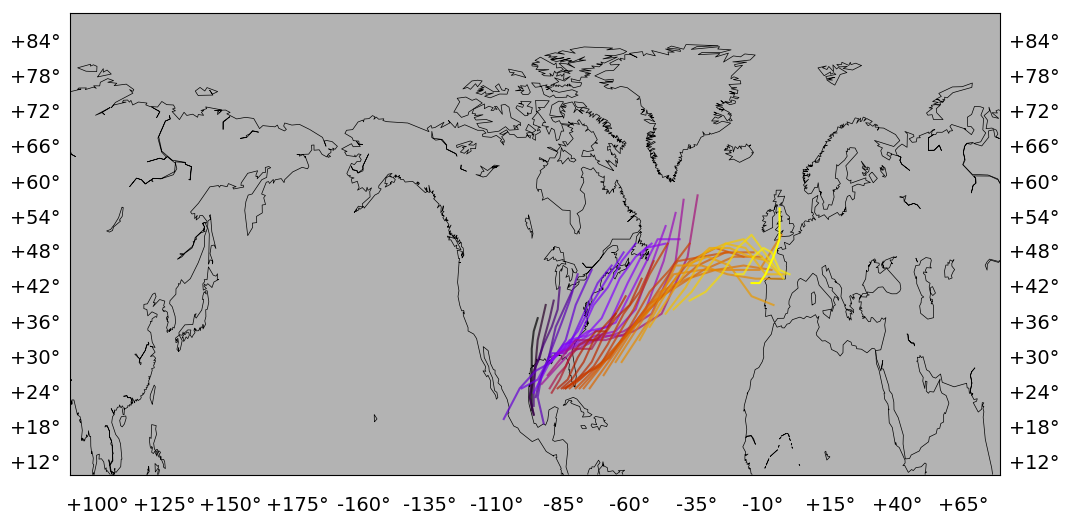
Fig. 7 Locations of a track labelled “198424” found in year 1984. Black to yellow color scheme indicates the evolution.
Dedicated Python script
You can use the scripts/trace_ARs.py script for AR tracking process in production.
Note
Unlike the AR occurrence detection process, this tracking process is time-dependent and therefore can not be paralleized. Also, if you divide the detection process into batches, e.g. one for each year, you may want to combine the output csv records into one big data file, and perform the tracking on this combined data file. This would prevent a track lasting from the end of one year into the next from being broken into 2.