IPART’s documentation
Table of Contents
Introduction
IPART (Image-Processing based Atmospheric River Tracking) is a Python package for automated Atmospheric River (AR) detection, axis finding and AR tracking from gridded Integrated Vapor Transport (IVT) data, for instance Reanalysis datasets.
An overview of what ARs are can be found in this review paper: Atmospheric rivers: a mini-review.
IPART is intended for researchers and students who are interested in the field of atmospheric river studies in the present day climate or future projections. Different from commonly used AR detection methods that rely on thresholding on the IVT magnitude, this package includes a method inspired by an image processing technique – Top-hap by reconstruction (THR).
Below is an example output figure:
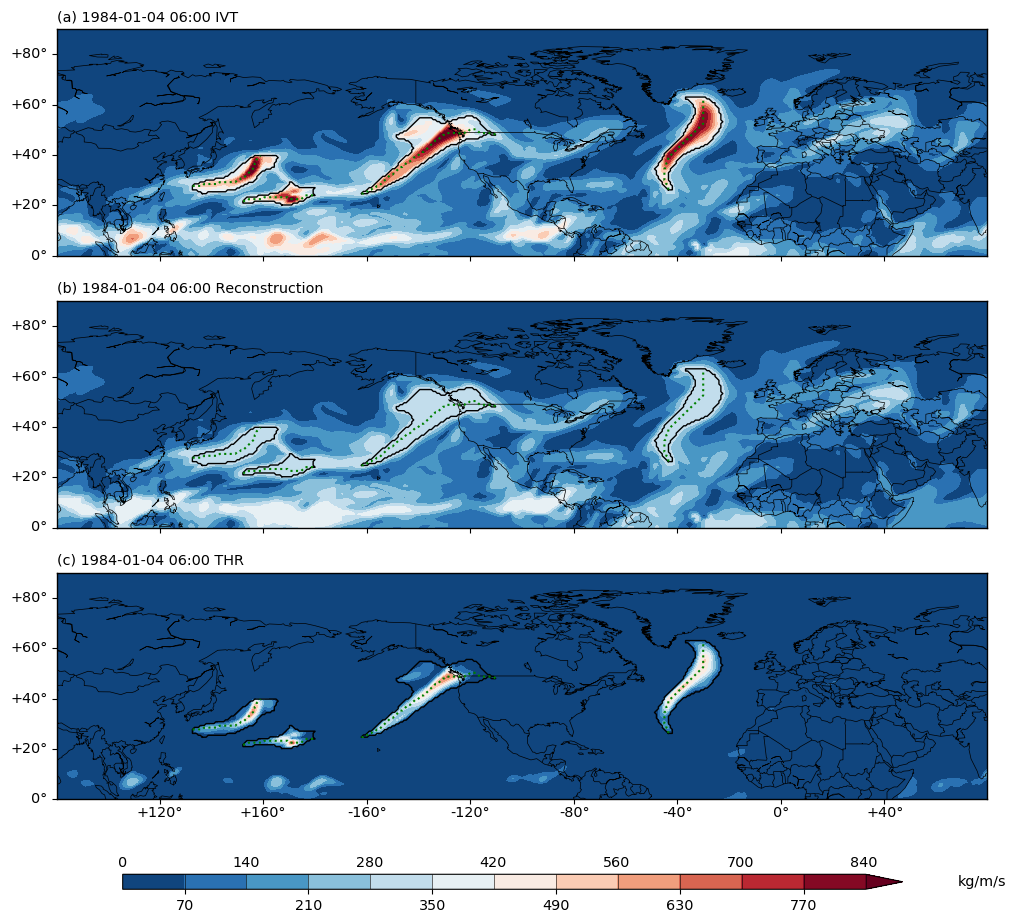
Fig. 1 (a) The IVT field in kg/(m*s) at 1984-01-04 06:00 UTC over the North Hemisphere. (b) the IVT reconstruction field at the same time point. (c) the IVT anomaly field from the THR process at the same time point. In all three subplots, the detected ARs are outlined in black contour. The AR axes are drawn in green dashed lines.
Installation
Install from conda-forge
ipart can be installed in an existing conda environment:
conda install -c conda-forge ipart
will install ipart and its dependencies for Python 3.
Create a conda environment using the environment file
Alternatively, users can obtain the code of this pacakge from the
github page, and create a new
conda environment using the environment files provided.
This way will install the optional cartopy package and allow you to run
the notebook examples.
git clone https://github.com/ihesp/IPART
cd IPART
conda env create -f environment_py3.yml
This creates a new environment named ipartpy3. Activate the environment using:
conda activate ipartpy3
After that, you can check the list of packages installed by:
conda list
Similarly for Python 2, use:
conda env create -f environment_py2.yml
Dependencies
- OS: Linux or MacOS. Windows is not tested.
- Python2.7 or Python3.7.
- netCDF4 (tested 1.4.2, 1.5.3 in py2, tested 1.5.3 in py3)
- numpy (developed in 1.16.5 in py2, tested 1.18.1, 1.19.0 in py3)
- scipy (developed in 1.2.1 in py2, tested 1.4.1, 1.5.1 in py3)
- matplotlib (tested 2.2.5 in py2, tested 3.3.1 in py3)
- pandas (developed in 0.23.4, 0.24.2 in py2, tested 1.0.3, 1.0.5 in py3)
- networkx (developed in 1.11 and 2.2 in py2, tested 2.4 in py3)
- scikit-image (developed in 0.14.2, 0.14.3 in py2, tested 0.16.2, 0.17.2 in py3)
- cartopy (optional, only used for plotting. Tested 0.17.0 in py2, tested 1.18.0 in py3)
Main functionalities
There are four main functionalities provided by the package that collectively constitute a specific workflow for the automated AR detection/tracking task:
- Perform THR computation on input data.
- Detect ARs from the outputs from the previous step, and at the same time,
- Identify the AR axis.
- Track ARs detected at individual time steps to form tracks.
More details regarding these steps are provided in separate pages below.
Applications on example data can be found in a series of example notebooks at github repository.
The automated AR detect/tracking workflow:
Github and Contact
The code of this package is hosted at https://github.com/ihesp/IPART.
For any queries, please contact xugzhi1987@gmail.com.
Contributing and getting help
We welcome contributions from the community. Please create a fork of the project on GitHub and use a pull request to propose your changes. We strongly encourage creating an issue before starting to work on major changes, to discuss these changes first.
For help using the package, please post issues on the project GitHub page.
